Reverse RSI Calculator by Screenulator ®
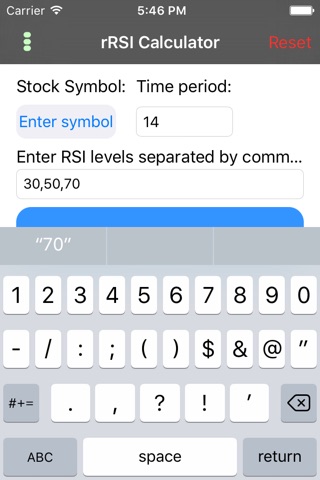
This app calculates RSI values and reverse RSI values (future stock prices of given RSI levels), therefore allowing you to set limit or stop prices at any desired RSI levels. It supports multiple RSI time periods, and RSI levels.
Relative Strength Index is a momentum oscillator that measures the speed and change of price movements. It is considered by many to be the single best indicator for Swing Trading by professional traders. RSI is considered overbought when above 70 and oversold when below 30. It can be used in varying degree of time frame - from day trading to long term investing. Most frequently used time periods are 2, 14, and 30 days.
This App lets user enter any stock symbol, or company name with auto-complete text box, shows near real time quotes and RSI values, and reverse RSI price levels. It supports stock symbols from US markets, with near real time data (15 minutes delayed data synched with Yahoo finance). Calculation is done by Screenulato, which is a proprietary technical analysis algorithms and chart pattern screeners for financial markets.
- Near real time stock quotes and RSI calculations
- Any RSI time period from 2 to 400
- Get multiple RSI levels at press of a button!
- Auto-complete text for instant stock symbol search!
- 15+ Supported markets: NASDAQ, NYSE, AMEX, TSX, HKEX, Australia, India (NSE), JKSE, Shenzhen, Shanghai, Singapore, UK, Paris, Brussels, Amsterdam, Milan, Athens


